kc.
Back to projects
systemssystemscloudschedulingkubernetes

Dynamic Scheduling for Latency-Critical Cloud Workloads

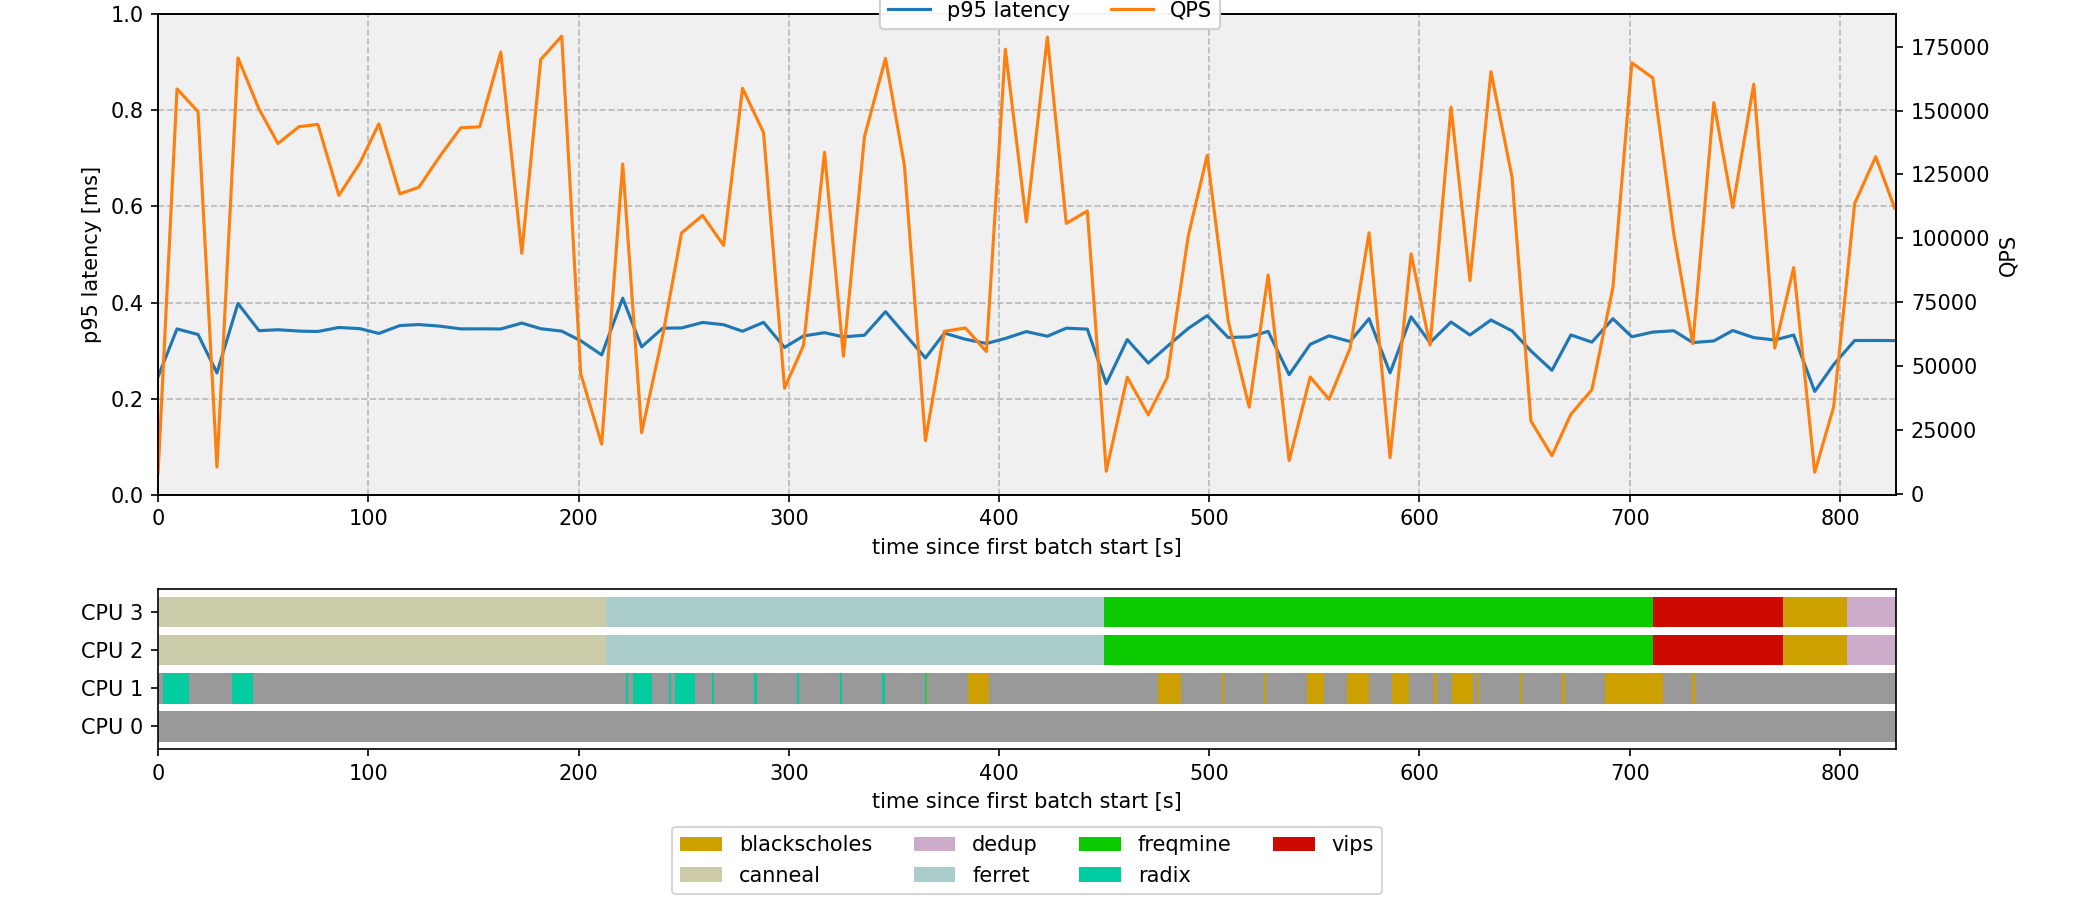
Dynamic CPU-allocation controller for Kubernetes that holds memcached's tail-latency SLO while running PARSEC batch jobs on freed cores.

ETH Zürich, Systems Group (Cloud Computing Architecture course) · Feb 2025 – Jun 2025

Dynamic Scheduling for Latency-Critical Cloud Workloads banner

Stack

  • Kubernetes
  • Docker
  • Google Cloud
  • Python

Role

Course project

Team

3 people

Repository

Overview

Cloud workloads mix latency-critical services like memcached (1 ms p95 at 30K QPS) with throughput-oriented batch jobs. They have to share hardware to keep utilisation up, but cache contention and memory-bandwidth pressure degrade tail latency the moment they're co-located. Static partitioning protects the SLO at the cost of cores left idle whenever the latency-critical service is quiet.

The project tackles this in four parts. First, characterise memcached and seven PARSEC batch workloads under explicit iBench interference. Then co-schedule them on a heterogeneous Kubernetes cluster. Finally, close the loop with a Python controller that reallocates CPU cores at runtime via Docker. The 0.8 ms p95 SLO holds under a dynamic 5K to 180K QPS trace while every batch job runs to completion.

What was built

Parts 1-2. Characterisation

Built the per-job interference matrix that drives every scheduling decision later in the project.

  • Swept memcached load against each kind of resource pressure (CPU, the cache hierarchy, memory bandwidth). CPU and instruction-cache contention killed tail latency past 35K QPS; the others stayed manageable.
  • Profiled seven batch workloads for sensitivity to the same kinds of pressure and for how well they parallelise across cores.
  • Outcome: which workloads scale, which don't, and which can sit next to memcached without breaking the SLO.

Part 3. Static co-scheduling on a heterogeneous cluster

Designed a placement policy that holds the 1 ms / 30K QPS SLO while finishing all seven batch jobs as fast as possible.

  • Cluster of two 2-core nodes and two 4-core nodes, with memcached pinned to a small node and the lowest-interference batch job sharing the other core.
  • Heavy jobs distributed across the larger nodes by interference profile and how well they scale. Mean makespan 158 s, 0 % SLO violations across three runs.

Part 4. Dynamic controller

Closed-loop scheduler on a single 4-core VM that watches memcached load and reallocates cores at runtime under a dynamic 5K to 180K QPS trace.

  • The controller watches CPU usage, pauses and resumes batch jobs as load swings, and shifts cores in and out of memcached on the fly.
  • Core 0 stays reserved for memcached; core 1 runs light batch jobs and hands itself over when load spikes; cores 2 and 3 run the heavier batch jobs throughout.
  • 0 % SLO violations across three runs; the controller keeps up with load changes as fast as every four seconds before it starts to fall behind.

Technical details

A Kubernetes cluster on a public cloud for Parts 1 to 3, and a single 4-core VM with a Python control loop for Part 4.

  • Latency-critical: memcached at 1 ms p95 / 30K QPS for Part 3, and 0.8 ms p95 across 5K to 180K dynamic for Part 4
  • Batch suite: seven PARSEC and SPLASH-2x workloads
  • Dynamic load trace: 5K to 180K QPS varying every 10 s
  • Scaling thresholds: 35 % CPU triggers a one-to-two-core scale-up, below 30 % scales back

Key technical decisions

  • Memcached on its own core, never sharing L1: Part 1 showed CPU and L1 instruction-cache interference both crash tail latency. Every later config isolates memcached on its own physical core.
  • Conservative threshold over fast threshold: Triggering the scale-up at 35 % CPU rather than 50 % cost a few seconds of makespan but eliminated the intermittent violations we saw under load spikes. The trade was a few seconds for zero misses.
  • Pause and resume over teardown: Tearing a container down is expensive and loses cache state. Pausing and resuming keeps the working set warm, so jobs hit the ground running when a core frees up.

Results

0.8 ms

p95 SLO held under dynamic trace

0 %

SLO violations across 3 runs (10 s interval)

158 s

Part 3 mean makespan (1 ms / 30K QPS)

809 s

Part 4 mean makespan (0.8 ms / 180K QPS dynamic)

Top 6

In-course ranking

Challenges & tradeoffs

  • Tail latency, not mean: p95 is what kills SLOs. A 200 ms spike from 0.5 to 1.2 ms is invisible in the mean but catastrophic for compliance.
  • Static partitioning wastes resources: Pre-allocating both cores to memcached protects the SLO but leaves a full core idle below ~120K QPS. Dynamic reallocation is the only way to recover it without breaking the SLO.
  • Tighter trace intervals hit controller latency: Pausing, resuming, and shifting cores all take finite time. Once the load changes faster than the controller can act, violations creep up. Four seconds is the tightest interval we held the SLO at; below that the controller can't keep up.

What I learned

  • Tail latency, not mean, governs SLO compliance. A workload can look fine on average and still violate the SLO at p95.
  • CPU and L1 instruction-cache contention dominate memcached's tail latency. L2, LLC, and memory bandwidth matter much less.
  • Closed-loop reallocation recovers the idle cores that static partitioning leaves on the table without breaking the SLO.
  • Controller cadence is bounded by action latency. Below 4 s intervals the controller couldn't keep up with QPS swings.

Gallery

  • 01 / 04Part 1. Memcached p95 latency vs achieved QPS under each interference source. CPU and L1 instruction-cache contention saturate around 35K QPS; L2, LLC, and memory bandwidth stay manageable up to ~70K. The interference matrix from this plot drives every co-location decision in Parts 3 and 4.
  • 02 / 04Part 2. Parallel-scaling speedup at 1, 2, 4, and 8 threads for the seven batch workloads. Some scale near-linearly, others plateau early. These curves drive the thread and core counts assigned to each job in the scheduler.
  • 03 / 04Part 3. Co-scheduling timeline (run 1). Memcached p95 (blue bars) stays under the 1 ms SLO line throughout the makespan; the Gantt panel below shows each batch job's window and the heterogeneous node it ran on. Mean makespan 158 s, 0 % SLO violations.
  • 04 / 04Part 4. Controller plot B (run 1). CPU allocation to memcached (left axis) tracks the dynamic QPS trace (right axis). The controller assigns a second core when load crosses ~120K QPS, then releases it during quiet periods so batch jobs can run on the freed core. The Gantt panel underneath shows per-core batch execution.

Next project

Mixed Reality Change Detection