kc.
Back to projects
impactwebsustainabilitymlforecasting

CarbonCompute Dashboard: BSc Thesis

Full-stack dashboard estimating and forecasting the carbon footprint of computational workloads across European regions.

University of Groningen · Oct 2023 – Aug 2024

CarbonCompute Dashboard: BSc Thesis banner

Stack

  • Next.js
  • React
  • Node.js
  • MongoDB
  • Python

Role

BSc Thesis author

Team

1 person

Repository

Overview

Computing's carbon footprint comes down to three things. How much power the hardware actually draws, how dirty the local grid is at that moment, and how long the work runs. Server emissions swing sharply with all three, but most online estimators substitute generic CPU TDP for real measured power and skip the temporal mix entirely. The result is that organisations have almost no honest visibility into when or where to schedule workloads to keep impact down.

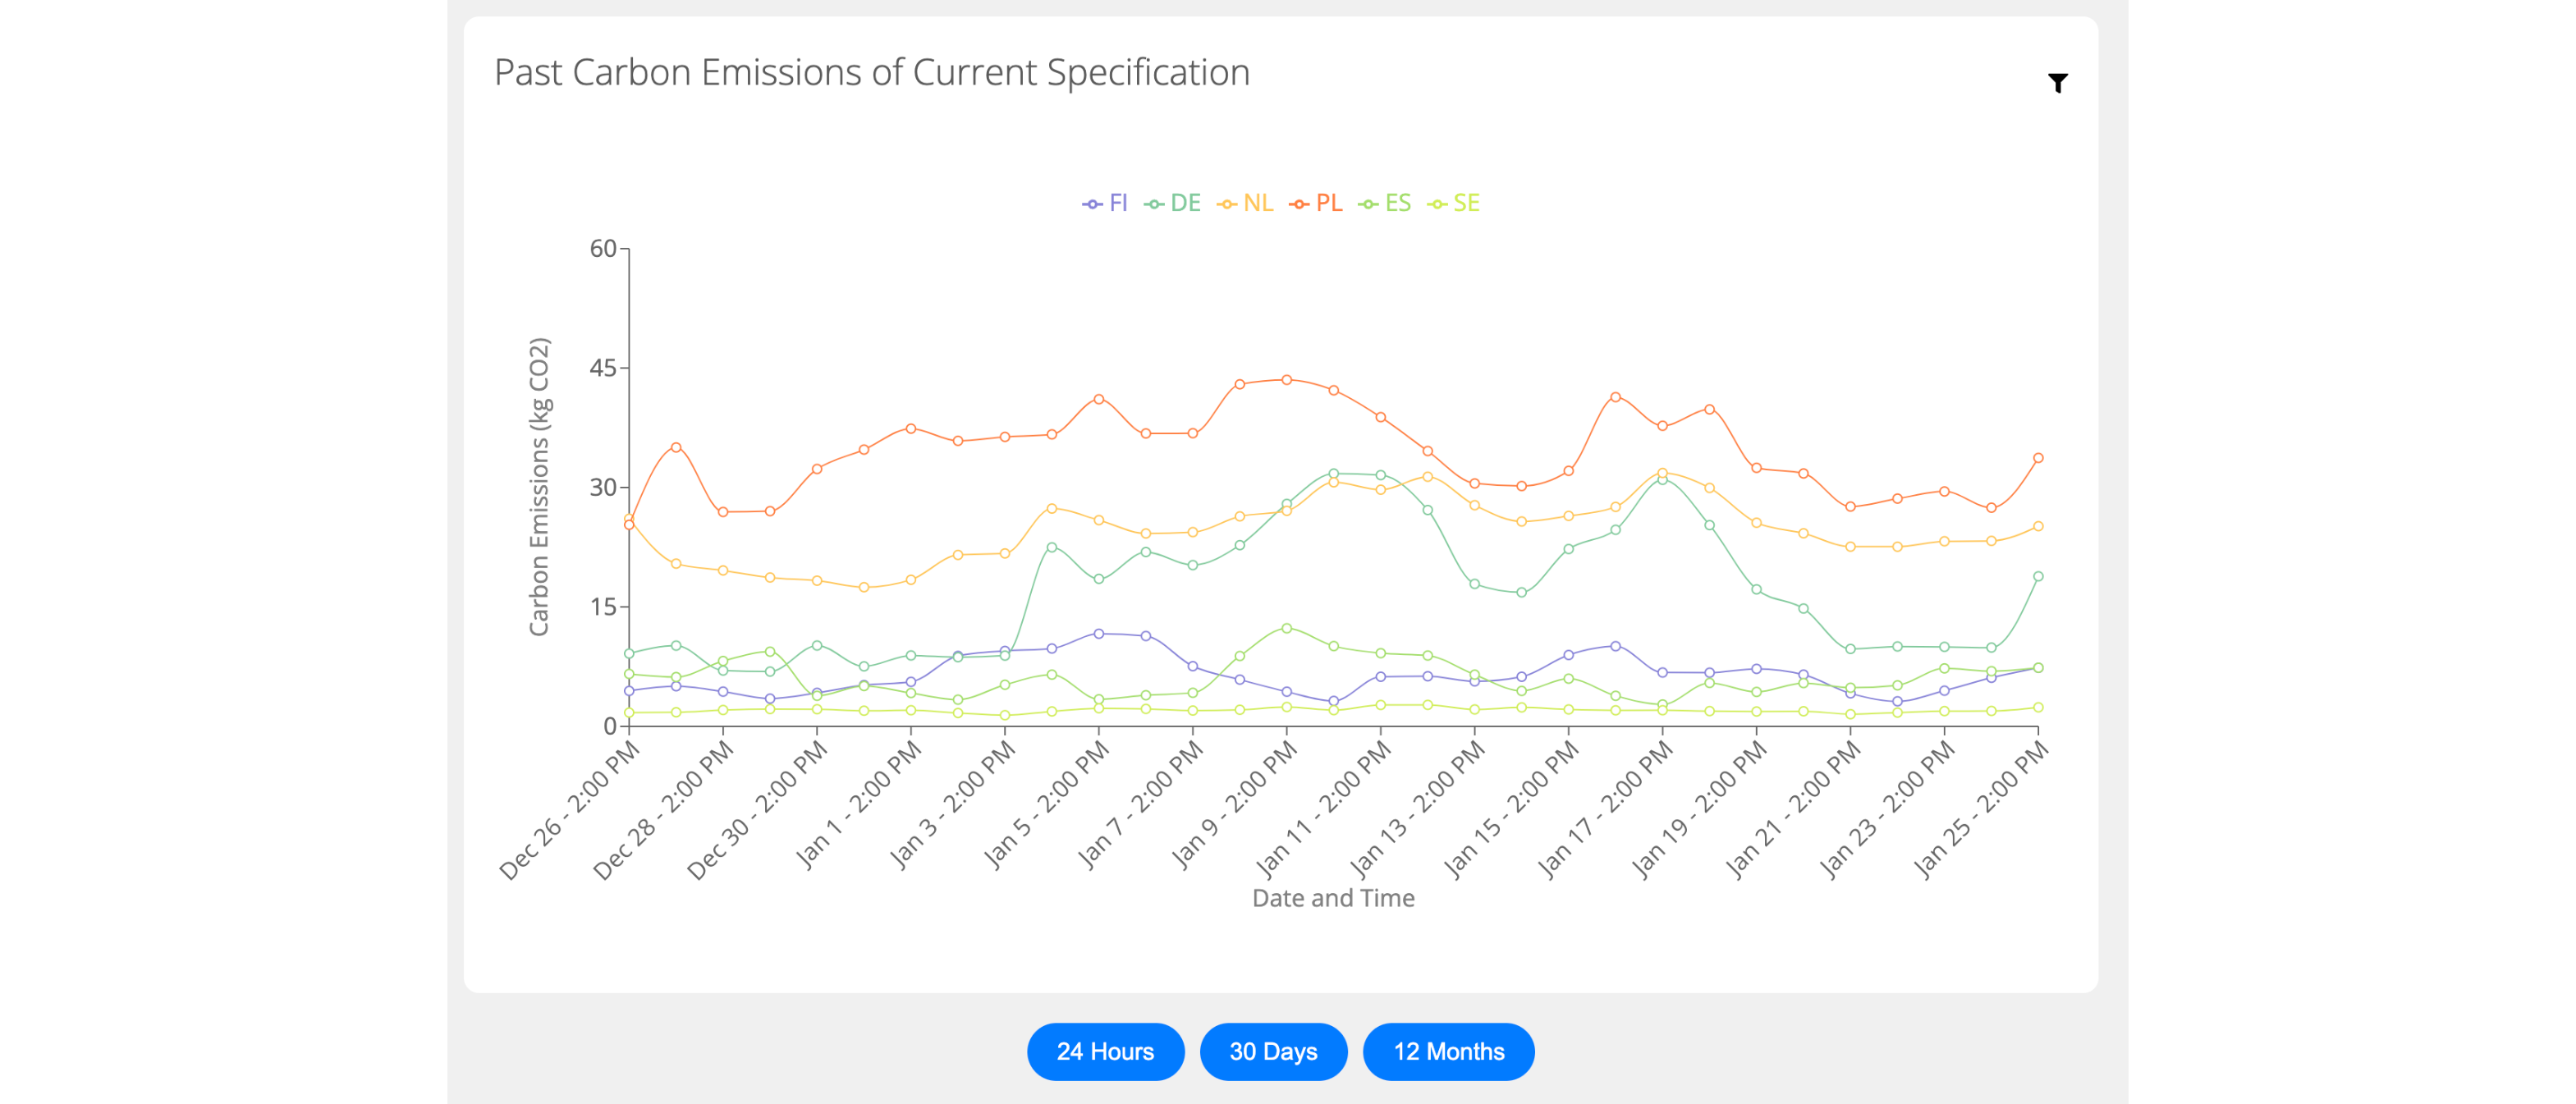
The dashboard combines all three signals. Under the hood: live ENTSO-E generation data, SPECpower ssj2008 benchmark measurements per CPU, and a 96-hour CarbonCast forecast that pairs per-source ANNs with a CNN-LSTM aggregator. Users pick a CPU, load level, runtime, PUE, and start time, then see per-region totals alongside 30-day and 12-month patterns that expose seasonal and time-of-day effects.

What I built

1. Data ingestion and Carbon Intensity calculation

Four years of hourly per-source generation data per region from ENTSO-E, distilled into hourly Carbon Intensity values.

  • Aggregates per-source generation and computes a direct CI as a weighted sum against per-source emission factors.
  • Cleans, normalises, and stores the result in MongoDB so it can be served quickly to the dashboard.

2. Per-task emissions estimator

Uses SPECpower ssj2008 measured power instead of generic CPU TDP, so the numbers reflect what the hardware actually draws.

  • Looks up real per-CPU power at the chosen load from the SPECpower ssj2008 database.
  • Combines that with runtime, PUE, and the hourly CI of the chosen region to produce a total emissions number.
  • The user picks CPU, load, runtime, PUE, and start time, and gets per-region totals across the six covered regions for direct comparison.

3. CarbonCast 96-hour forecasting

Two-tier deep-learning pipeline that forecasts CI up to four days ahead, so users can schedule workloads at the cleanest hours.

  • First tier: per-fuel-source ANNs (biomass, coal, gas, nuclear, hydro, solar, wind) conditioned on ECMWF/NOAA weather and day-ahead solar/wind data.
  • Second tier: a CNN-LSTM that aggregates the per-source forecasts into a single carbon-intensity prediction.
  • Pre-trained for Germany; the data and training pipeline generalise to any region with the right inputs.

4. Interactive dashboard

Next.js + React + MUI front-end with five views: past, present, future, and the estimator.

  • Past 24-hour: live regional emissions across the most recent day for direct comparison.
  • Hourly breakdown: emissions per hour for the chosen workload, exposing time-of-day effects.
  • 30-day and 12-month views: seasonal and weekday patterns in CI per region.
  • Estimator and forecast: per-region totals plus the 96-hour prediction overlaid against historical CI so users can pick low-emission windows.

Technical details

Three-tier web stack with two ML pipelines on the data side. Frontend, backend, and database run as separate services; CarbonCast and the data-cleaning scripts run offline.

  • Frontend: Next.js + React + MUI
  • Backend: Node.js + Express REST API
  • Database: MongoDB (CI history + benchmark collections)
  • Forecasting: CarbonCast (per-source ANN + CNN-LSTM aggregator) in Python
  • Data sources: ENTSO-E, SPECpower ssj2008, ECMWF/NOAA

Key technical decisions

  • SPECpower ssj2008, not generic TDP: SPECpower ssj2008 gives real power at multiple load levels per CPU. Manufacturer TDP overcounts idle and undercounts peak. Substituting measured numbers is the difference between a rough estimate and an honest one.
  • Hourly CI from the actual generation mix: Computing CI per hour from the real source mix reflects high-solar-at-midday and gas-at-peak. Published regional averages wash out the time signal the dashboard depends on.
  • Two-tier forecasting: Forecasting CI directly is hard because it depends on signals that don't move together: weather drives solar and wind, demand drives coal and gas. Forecasting each source independently and aggregating afterwards gives the second tier cleaner inputs.
  • Retraining beats re-architecting: The pre-trained CarbonCast checkpoint had Day-1 RMSE 94.43 and MAPE 42.92 %. Retraining on up-to-date German ENTSO-E data dropped that to RMSE 70.75 and MAPE 25.41 %, same architecture. Pipelines lose calibration as distributions shift, and fresh data is the cheapest fix.

Results

32.86 %

Forecasting MAPE (4-day, Germany, retrained, down from 56.78 %)

82.64

Forecasting RMSE (down from 118.31 before retraining)

6

European regions in the dashboard

96 h

Carbon-intensity forecast horizon

4 yr

Historical ENTSO-E coverage (2020-2024)

Challenges & tradeoffs

  • Generic TDP misrepresents real CPU power: Substituting SPECpower ssj2008 measurements per CPU needed a separate benchmark dataset and a lookup pipeline, but it's the only path to honest emissions numbers.
  • Forecasting models drift: CarbonCast's pre-trained checkpoints lose accuracy as the energy mix evolves. Retraining on the latest four years of ENTSO-E data dropped Day-1 MAPE from 42.92 % to 25.41 % without changing the architecture.
  • Constant-power assumption: The current model assumes power doesn't vary during a run. Real systems have load-dependent inefficiencies, and a future iteration should model power as a function of time.
  • Not yet a continuous pipeline: The system runs as discrete services rather than an automated loop. A scheduled job that pulls fresh data every day and regenerates forecasts is the missing piece for real-time deployment.

What I learned

  • Generic CPU TDP and SPECpower ssj2008 measurements diverge enough at real load levels that one gives rough estimates and the other gives honest ones.
  • Hourly CI from the actual generation mix carries time signal that regional averages wash out. The dashboard's value depends on keeping that signal.
  • Two-tier forecasting (per-source ANN feeding a CNN-LSTM) gives the aggregator cleaner inputs than forecasting CI directly.
  • Refitting CarbonCast on current ENTSO-E data cut Day-1 MAPE from 42.92 % to 25.41 % without architecture changes. Retraining beats re-architecting on drifted distributions.

Gallery

  • 01 / 04High-level architecture. The Next.js frontend talks to a Node.js + Express backend, which queries MongoDB for historical CI and SPECpower benchmark data; CarbonCast runs offline to generate 96-hour forecasts that feed the same database.
  • 02 / 04The estimator view. Users pick CPU model, load level, runtime, PUE, and start time; the dashboard returns total emissions per region using SPECpower-measured power × hourly CI rather than generic TDP.
  • 03 / 04Hourly breakdown view. The same workload runs at different costs depending on the hour and region: peak emissions during gas-heavy evenings, low emissions during solar-rich midday slots.
  • 04 / 04CarbonCast 96-hour forecast vs ground truth for Germany after retraining. Day-1 RMSE drops from 94.43 to 70.75 and MAPE from 42.92 % to 25.41 %; daily and hourly trends are captured cleanly.

Next project

Stock Market Simulation